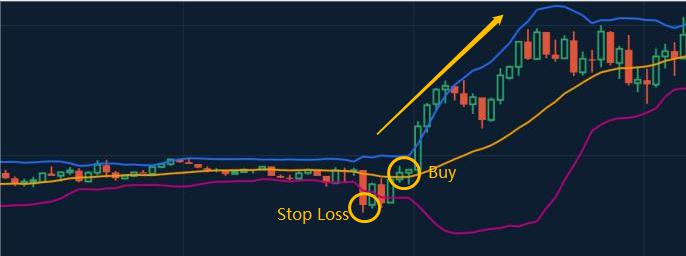
Anticipation Strategy Anticipation Strategy refers to the traders forecast the final breakout direction of the market, early placement of positions, rather than wait until the obvious breakout signal. There is possible to ...
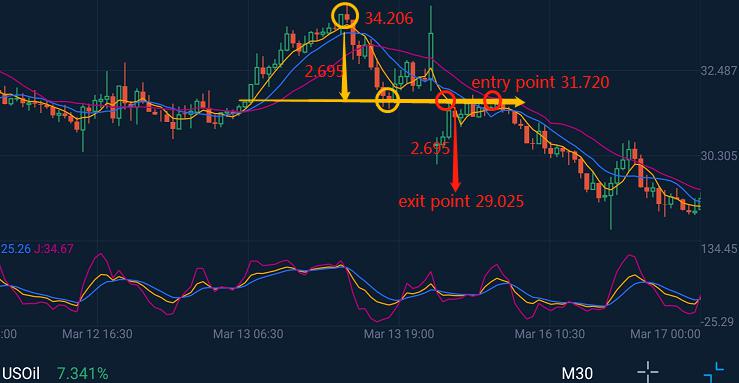
A profit target is a pre-determined price level where you will close the trade. Day traders should always know why and how they will get out of a trade. There are multiple ways to determine where to get out. 1...
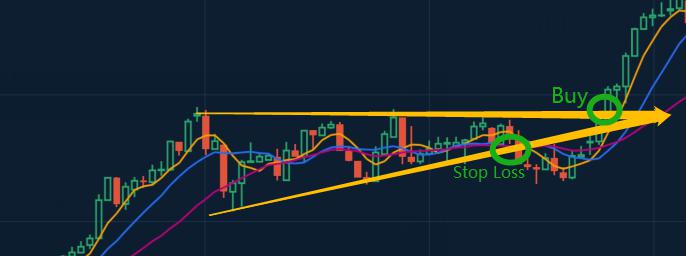
Breakout Strategy Breakout Strategy refers to make a position when the price has obvious directional signals. Different from the Anticipation Strategy, the direction is confirm by combination of shape, trend line, channel and other indicat...
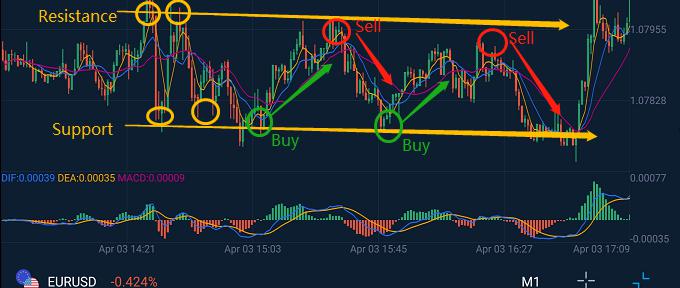
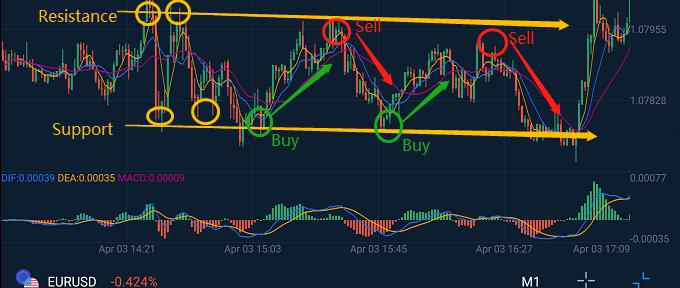
Minute chart trading method for day trading - Support & Resistance 1. Identify Support & Resistance The line connects with the two price reversal points called support line or resistance line. When the reversal turns to the d...
1. What To Focus On When Day Trading To excellent Day Trade you need live price charts, and also an economic calendar, which can cause large instantaneous price moves. But to a New Day Trader, all the information you need to trade is right...
Most investors focus on how to find or develop a good trading strategy to make profits, but ignore what should do first. What more important is the Risk Management. It is the foundation of your transaction. Only protect your assets well, you can arrang...
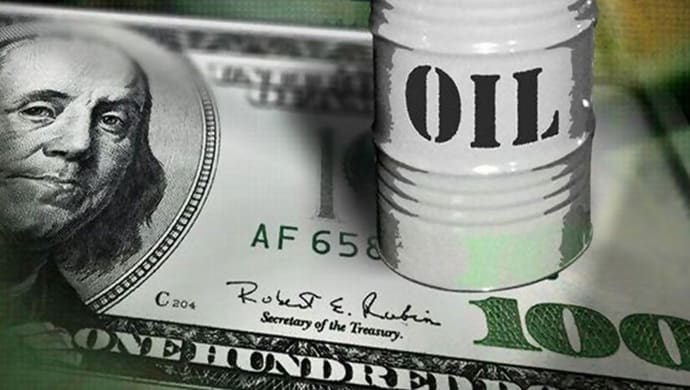
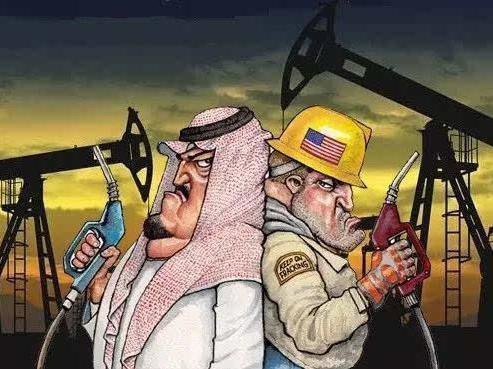
The United States plays an important role in the global economy today, mainly because of its early control of global crude oil supply. One of the main reasons why the US dollar has become the world's reserve currency is that it has dominated the global...
British Prime Minister Boris Johnson talked tough on Sunday ahead of a crucial round of post-Brexit trade talks with the European Union, saying Britain could walk away from the talks within weeks and insisting that a no-deal exit would be a "good outco...
Forex War QE enables more efficient circulation of global capital, and foreign exchange will become an important medium. Investors use the foreign exchange market to buy stocks, bond markets, futures markets, and even real estate markets i...
On Thursday, the U.S. dollar continued to rise after hitting a high in more than eight weeks. There are still 40 days to go before the U.S. election. The importance of the U.S. election trend on the dollar index is gradually increasing. ...
If Trump loses power, gold prices may rise before the election Under the epidemic, the Federal Reserve introduced an unlimited amount of easing policy, coupled with Congress’s rescue plan, which triggered a bubble in the financial market. ...
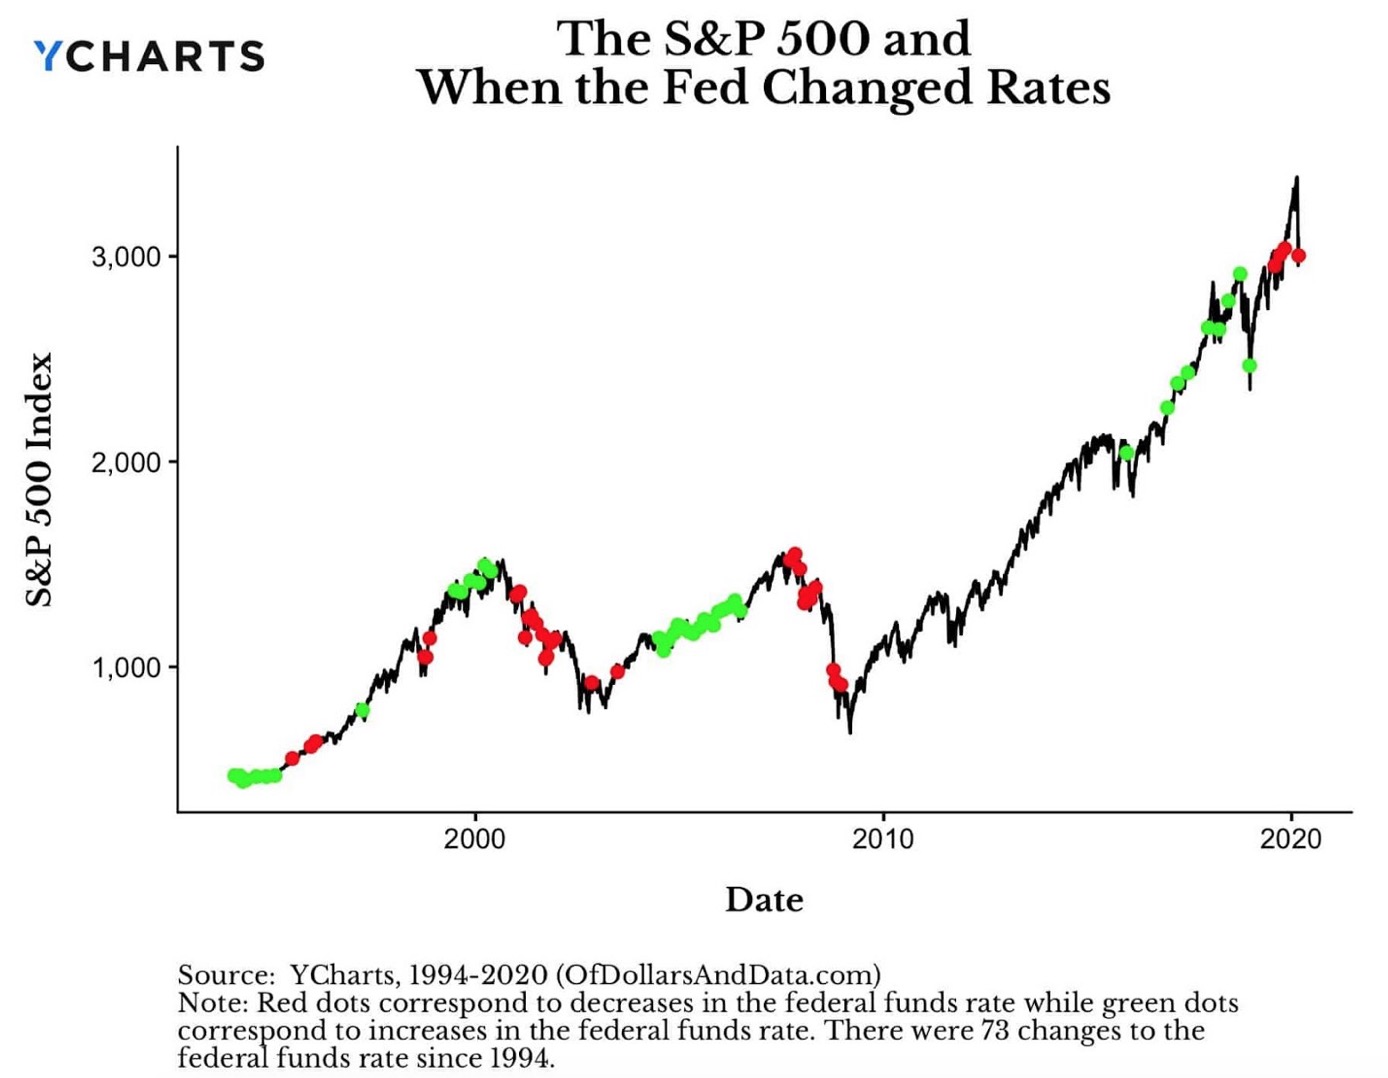
Reduction of Interest Banks use interest rate adjustments to change the financial method of cash flow. When the bank cuts interest rates, the income from depositing funds in the bank decreases. Therefore, the interest rate cut will cause f...
Since the outbreak of COVID-19 in 2020, the global economy has entered a recession, with gold soaring, stock markets tumbling, and oil prices plummeting. Saudi Arabia cut pricing for oil sales to Asia and the U.S. for October shipments...
President Trump tested positive for Covid-19 as the election approaches. Investors must brace for a turbulent October in the market. The U.S. dollar devaluated recently, and the market is still in a bit of a risk-on mood right now. ...
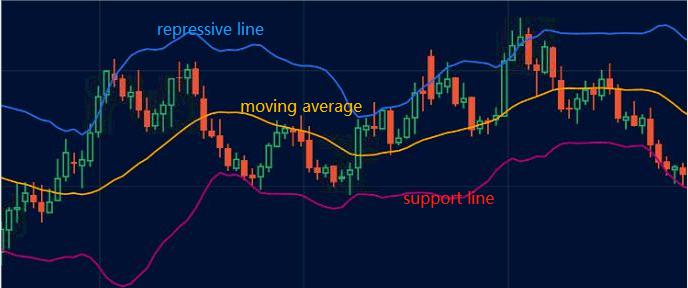
What is Bollinger Bands? Bollinger Bands are the technical indicator which consist of three lines: Upper rail, middle rail and lower rail. middle rail is the price moving average, Upper rail is the repressive line, lower ...
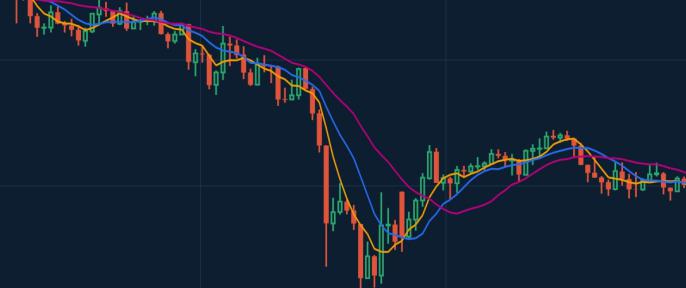
What is MA? moving average is a line displays the price trend over a certain period of time. Depending on the time period, MA can be divided into short-term medium-term and long-term. ...
What is MACD? Moving Average Convergence Divergence, is a medium- and long-term trend index, widely used by investors. MACD is a combination of two lines: the slower moving average DEA and the f...
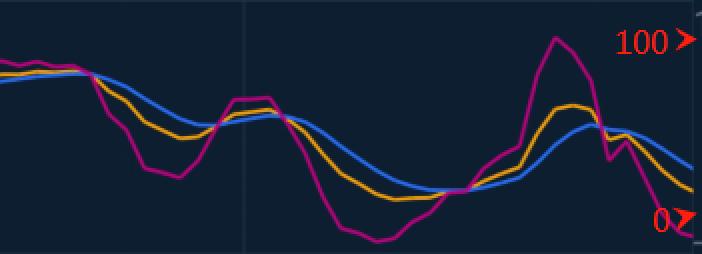
What is KDJ? KDJ consists of 3 lines: faster moving line-K value, slower moving line-D value and confirm line- J value. These three lines move between value 0-100, providing the signals of Buy and Sell in sh...
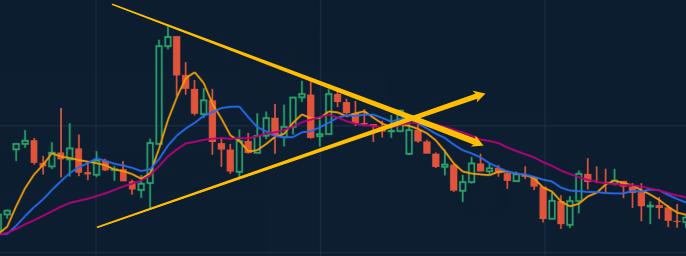
Symmetrical Triangle The price fluctuates up and down and the rising high is lower than the previous one, and the falling low is higher than the previous one. Price movements become narrower and narrower,that shaped a symmetrical triangle....
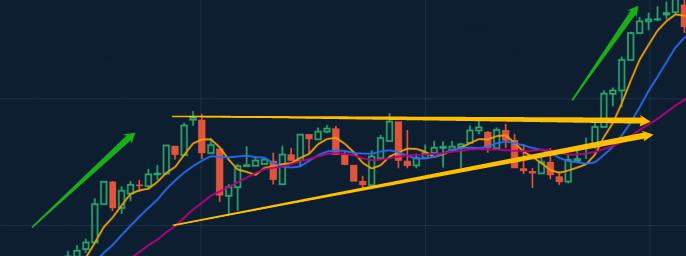
Ascending Triangle The price rising lows are higher than recent one, and falling highs reach similar price levels, that shaped a Ascending Triangle. When the price moves at the end of the this pattern, it will breakout and rise up with hig...
 English
 简体中文
简体中文
 Tiếng Việt
 Malay
Malay
 Indonesia
 Deutsch
 Français
 Español
 Italiano
