Triangle Chart Patterns(1)
2021-07-05Symmetrical Triangle
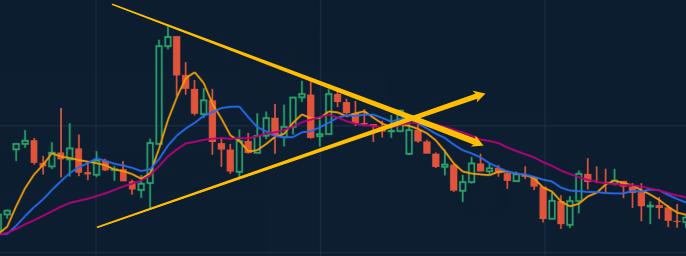
The price fluctuates up and down and the rising high is lower than the previous one, and the falling low is higher than the previous one. Price movements become narrower and narrower,that shaped a symmetrical triangle.
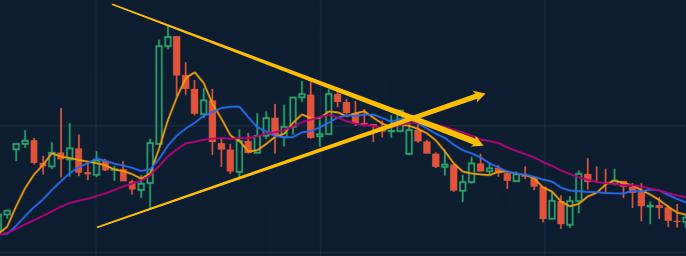
How to trade in a symmetrical triangle?
Draw a trendline of three swing highs and three swing lows of the symmetric triangle. We can Buy when the price breakouts above the upper trendline, or short Sell when the price drops below the lower trendline of the symmetrical triangle. And place the loss stop at the recent swing high or swing low.
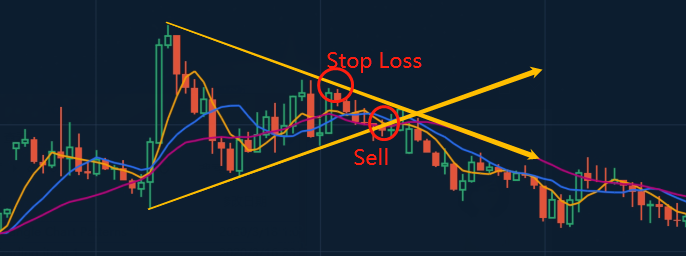
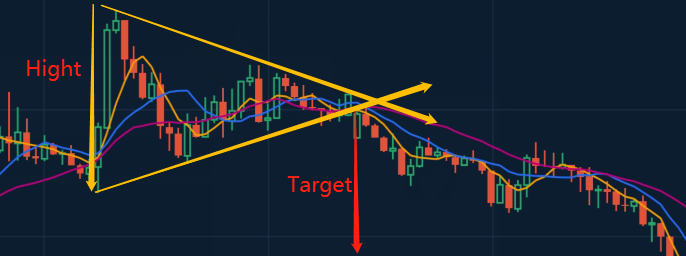
The profit target is the height of the symmetrical triangle pattern. We can subtract the first falling low price from the first rising high price of the pattern. This gives us the height of the pattern, also the profit space.
More Triangle Chart Pattern see "Triangle Chart Pattern (2) " & "Triangle Chart Pattern (3)" in master skills.
 English
 简体中文
简体中文
 Tiếng Việt
 Malay
Malay
 Indonesia
 Deutsch
 Français
 Español
 Italiano
