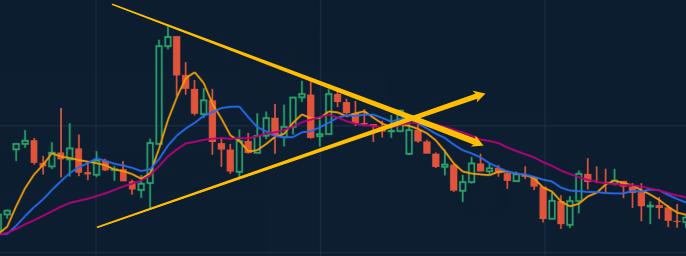
Symmetrical Triangle The price fluctuates up and down and the rising high is lower than the previous one, and the falling low is higher than the previous one. Price movements become narrower and narrower,that shaped a symmetrical triangle....
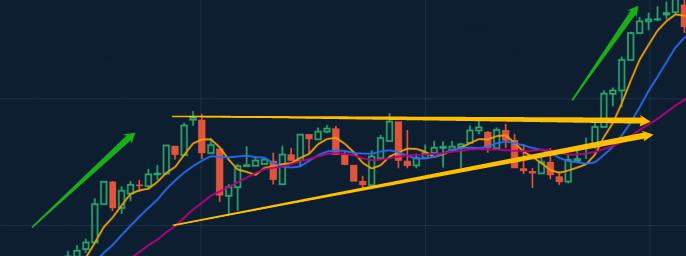
Ascending Triangle The price rising lows are higher than recent one, and falling highs reach similar price levels, that shaped a Ascending Triangle. When the price moves at the end of the this pattern, it will breakout and rise up with hig...
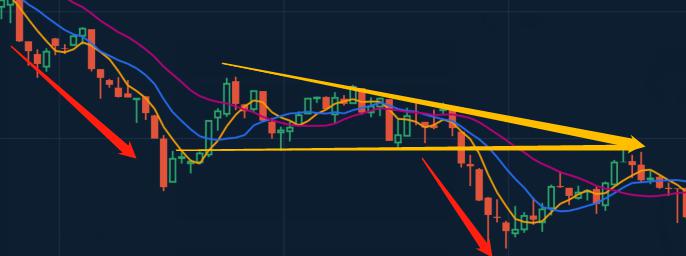
Descending Triangle A Descending Triangle is formed by lower swing highs, and swing lows that reach similar price levels. When the price moves at the end of the this pattern, it will breakout and fall down with high probability. ...
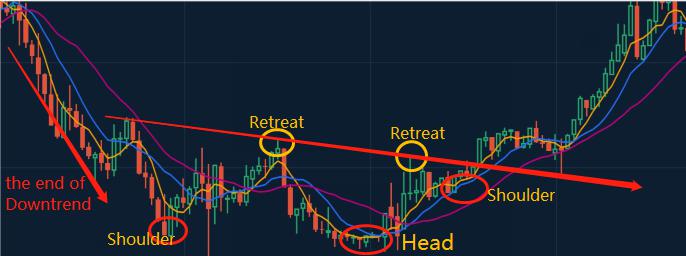
The Head and Shoulder Bottom Pattern occurs during a downtrend and marks its end. This chart pattern shows three lows, with two retracements in between. How to Trade This Patt...
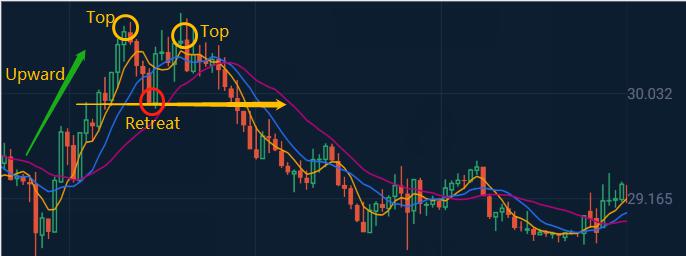
A Double Top Pattern occurs in uptrend when the price reaches a high point, retraces, rallies back to a similar high point, and then declines again. The low point of the retracement between the two peaks is marked with neckline. This l...
 English
 简体中文
简体中文
 Tiếng Việt
 Malay
Malay
 Indonesia
 Deutsch
 Français
 Español
 Italiano
