Guideline for price chart
2021-07-05As we all know, the most important thing of CFD trading is to predict the price trend of the product. Based on the prediction, we set up long or short positions to earn the price difference.
The first step in price prediction is to read the chart.
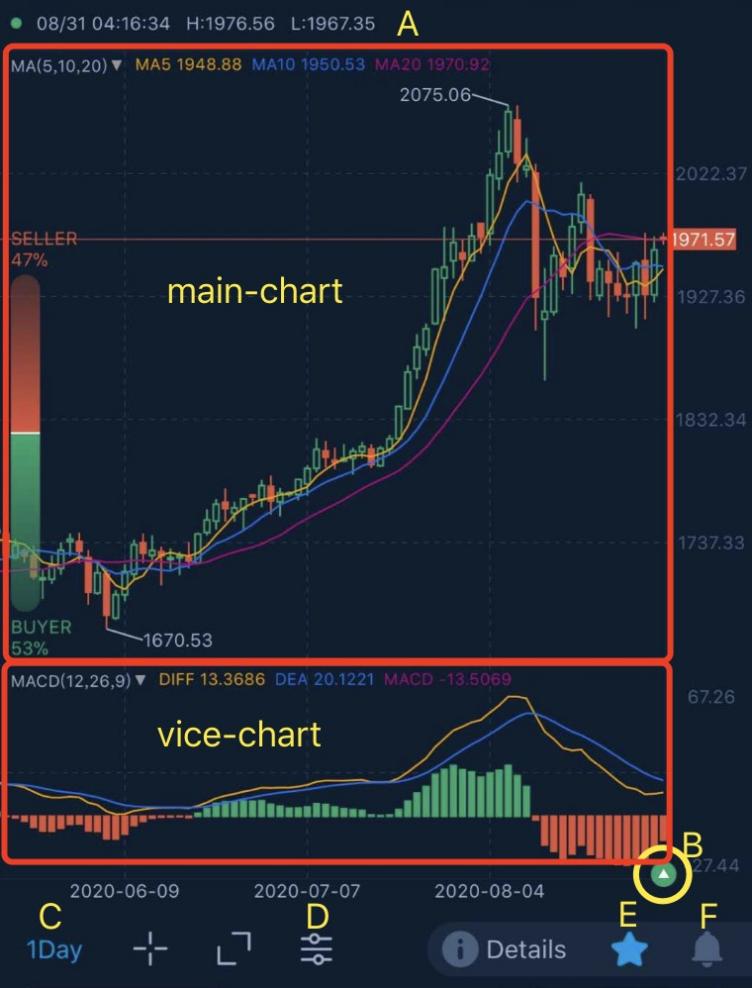
The trend chart is a technical graphic that displays the market price, time, market sentiment, technical indicators and other information. As following shows:
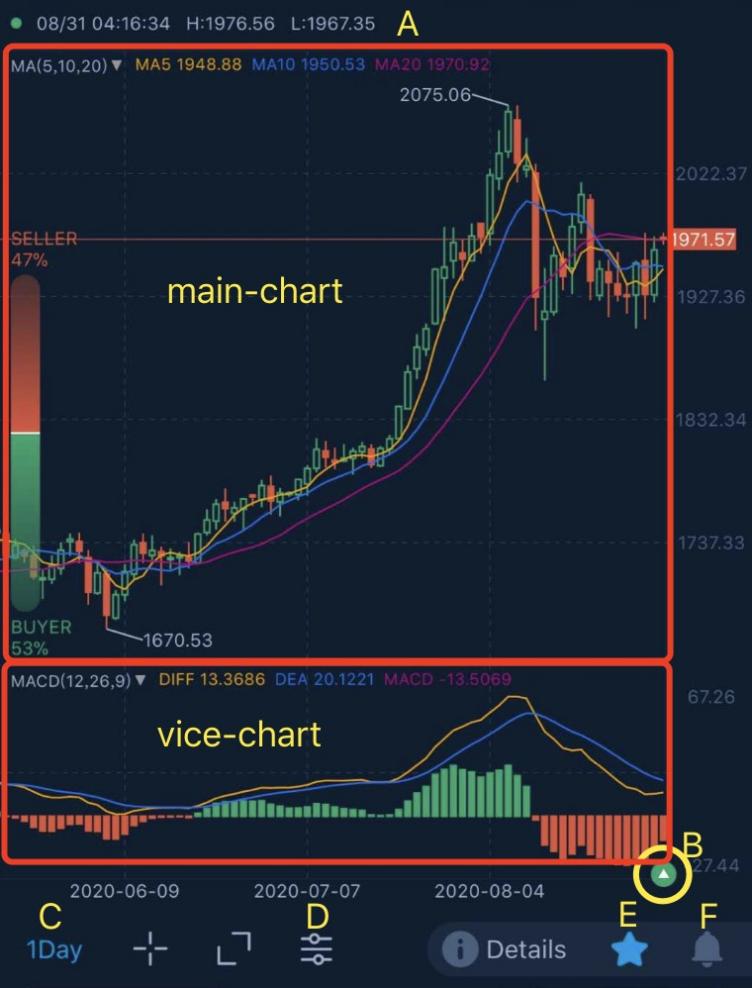
- 1. The horizontal axis of the chart is a fixed time period, the upper half of the vertical axis is the product price or index of the time period, and the lower half shows the indicator parameters;
- 2. On the main-chart, the K lines are the pattern drawn in different time periods; the red horizontal line is the current selling price; the red, yellow and blue curves around the K lines are the MA technical indicators, click the curve can change indicators;
- 3. Vice-chart is a technical analysis indicator, MACD, RSI, KDJ for reference, click the vice-chart to change to another indicators;
- 4. A is the current date;
- 5. B is a day trading strategy provided by Trading Central(a professional organization). you can click the green label to display the trading strategy;
- 6. C is the chart time period, click to select time- line, minute, 1hour, 1day or others ;
- 7. D is the chart setting, after clicking, you can set the chart type, display form, etc.;
- 8. E is selected as favorite, light up the five-pointed star to add to your favorite list;
- 9. F is the alerts setting, you can set the price that you need pay attention to.
 English
 简体中文
简体中文
 Tiếng Việt
 Malay
Malay
 Indonesia
 Deutsch
 Français
 Español
 Italiano
