Getting Started with Trade Ideas
Our signature chart
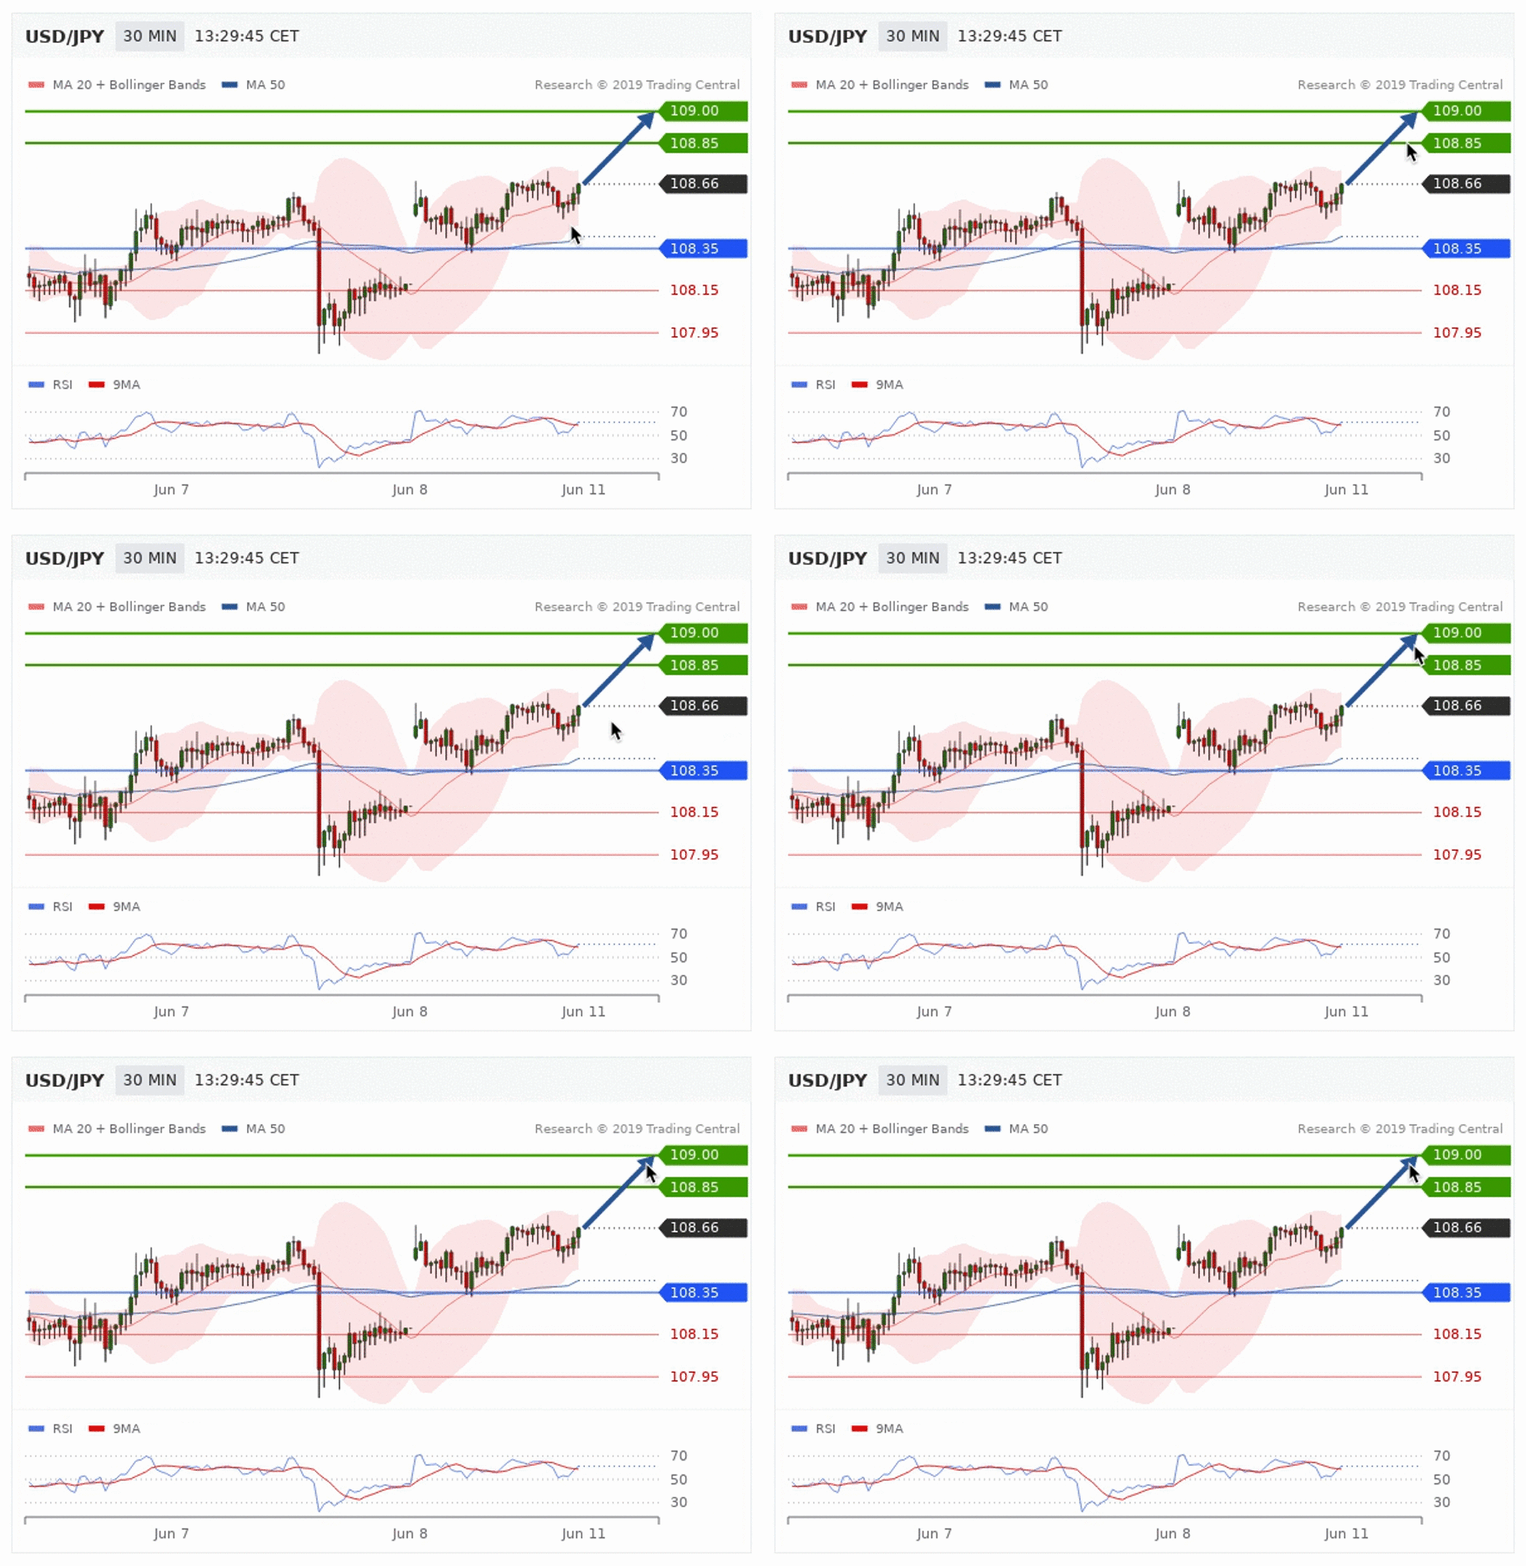
Here we are looking at a signature chart by Equinox Markets. There may be indicators, patterns or trend lines plotted on the price chart. This gives you a glimpse into the technical analysis methodology, but let’s focus on the output.

A clear sense of direction
The bold blue arrow gives an immediate and clear sense of direction. In this case, the anticipated scenario is that the price may rise.

Watch the pivot
The anticipated scenario is only the preference as long as the price remains above this blue pivot line. If the price crosses the pivot line, the alternative scenario kicks in and prices are expected to go in the other direction.
Stops help you preserve capital
Our trading customers often use this pivot level as a stop price to protect their position. Hitting this stop means the reason for being in the position no longer exists, so they close their position.

Targets help you take profits
Now, stops are important but let’s also plan to exit with a profit! For this rising price situation, we offer two resistance levels to use as targets. A typical approach is to close half the position at the first target to lock in some profit, and close the other half of the position at the second target level.

We hope you now understand how beneficial it is to have the Equinox Markets research team on your side and how simple it is to harness their insights! Take advantage of Trade Ideas today to plan your trades with expert technical analysis!
 English
 简体中文
简体中文
 Tiếng Việt
 Malay
Malay
 Indonesia
 Deutsch
 Français
 Español
 Italiano